Executive asks a follow-up “Why?” question
Legacy BI & Excel
Wait 3–5 days for an analyst to pull CSVs and update a slide
Orzed AI Reporting
Type the question in plain English and get the root-cause breakdown in 2 seconds
Stop digging through 40 dashboard tabs or waiting days for CSV exports. We unify your CRM, ERP, store, ad spend and financial data into a governed semantic layer, giving your leadership team an AI data copilot, 24/7 anomaly radar and automated 07:30 executive briefings.
INTERACTIVE DECISION COPILOT
Select a leadership lens below to inspect the live data sources, plain-English query, root-cause diagnosis and recommended action.
German paid search shifted 28% of spend toward low-margin starter SKUs while DHL air-freight surcharges rose €14,200. Pausing 3 broad-match ad groups and routing DE fulfillment via Rotterdam restores +4.1% margin this week.
Unlike generic chatbots that guess math, our AI translates your question into deterministic, audited SQL against your governed dbt semantic layer, so Finance and Operations can trust every number to the cent.
ARCHITECTURE X-RAY
Tap any numbered checkpoint on the schematic to see how we eliminate manual Excel work and AI math hallucinations.
We pipe CRM, ERP, Stripe, Shopify, PMS, Google/Meta Ads and Postgres into one clean, deduplicated warehouse (BigQuery, Snowflake or ClickHouse).
LLMs never guess formulas. Revenue, CAC, LTV, churn and margin are locked in a governed dbt/semantic layer so every answer is 100% mathematically exact.
Executives and managers type questions in plain English or Turkish and get instant charts, cohort tables and root-cause explanations.
Instead of discovering a broken checkout or ad-spend spike two weeks later, AI monitors every metric stream and alerts you the hour it shifts.
Every morning at 07:30, leadership receives a concise narrative summary of yesterday’s revenue, cash, pipeline and top 3 recommended actions.
SPREADSHEET CHAOS VS AI REPORTING
Wait 3–5 days for an analyst to pull CSVs and update a slide
Type the question in plain English and get the root-cause breakdown in 2 seconds
30 minutes arguing over why HubSpot, Stripe and GA4 numbers don’t match
One governed semantic layer where Finance, Marketing and Sales match to the cent
Graveyard of complex charts nobody has time to interpret
Concise AI morning brief highlighting what changed, why, and what to do today
Discovered at the end of the month after thousands in lost margin
Flagged within the hour by automated ML anomaly detection with root cause
Pasting sensitive spreadsheets into public ChatGPT with guessed math
Private, RBAC-governed architecture where AI only executes deterministic SQL
INTELLIGENCE ARCHITECTURE
Ask any question about revenue, ads, cohorts or operations and get a verified chart in seconds.
No more waiting four days for an analyst to write SQL or build a Looker studio tab. Your leadership team asks questions in plain language via web, Slack or Teams, and our text-to-semantic-SQL engine returns audited numbers and visual charts.
Daily, weekly and monthly narrative reports written and delivered automatically.
Dashboards fail when nobody logs in to read them. We build scheduled AI briefing pipelines that synthesize P&L, pipeline velocity, ad ROAS/MER and operational bottlenecks into crisp executive memos delivered to Slack, WhatsApp or email.
Catch margin leaks, conversion drops and stockouts before they hit your P&L.
Our ML monitoring agents watch conversion rates by device, SKU return spikes, CAC creep and cloud/vendor costs around the clock. When a metric deviates from seasonal norms, it isolates the root cause and flags the owner immediately.
One source of truth across CRM, ERP, e-commerce, ad platforms and production databases.
When Marketing, Finance and Sales bring three different revenue numbers to the Monday meeting, trust breaks. We engineer the underlying ELT pipelines, dbt models and role-based access controls so every department queries the exact same truth.
BUILT FOR DECISION MAKERS

Wake up to a clear summary of yesterday’s net revenue, CAC, cash and top 3 priorities in Slack, WhatsApp or email.
See briefing sample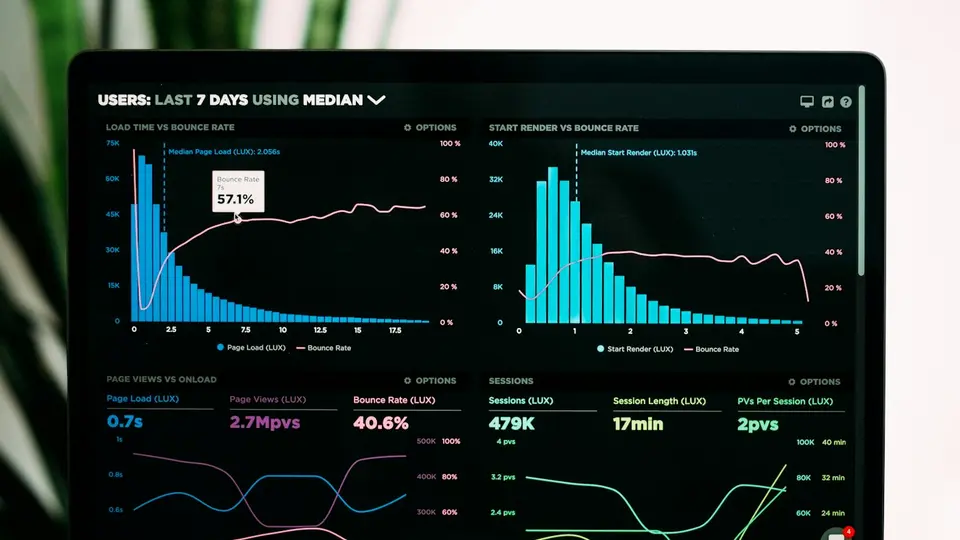
Ask “Why did churn rise in Q3?” and get audited charts grounded in your semantic layer.
Try AI copilot
Automated ML watchdogs flag ad waste, funnel breaks and inventory risks before month-end.
Enable anomaly radar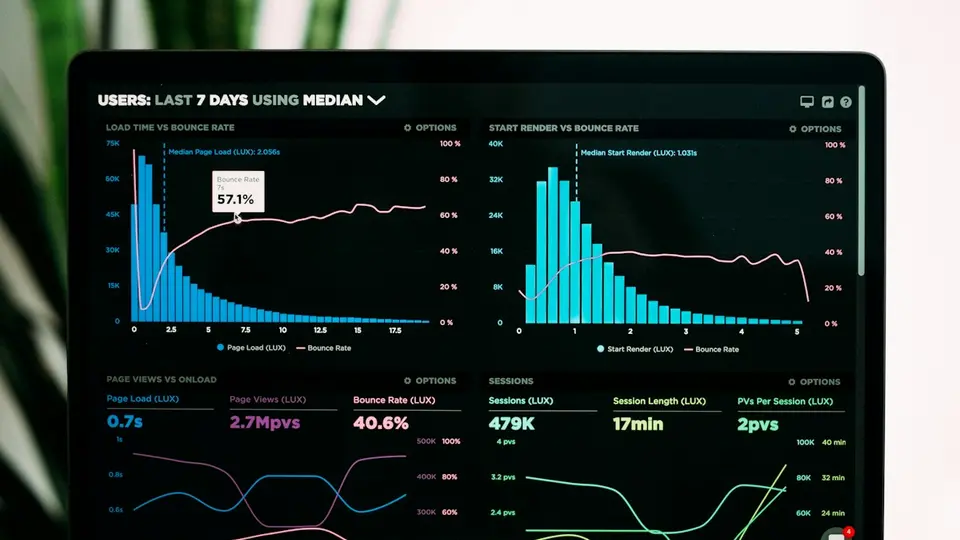
Eliminate spreadsheet chaos with a governed warehouse where every department’s numbers match.
Unify my dataWAYS TO START
Connect your core revenue, ad spend and CRM sources into one live command center with daily automated AI briefings.
For scaling companies that want a modern warehouse, governed dbt semantic layer and natural-language AI data copilot.
Embed natural-language reporting and AI insights directly inside your own SaaS product or client portal.
Adjacent capabilities
Warehouses, streaming pipelines, dbt transformations and schema contracts.
GovernanceExecutive KPI governance, board reporting and multi-touch attribution models.
PipelineHubSpot, Salesforce and CPQ automation feeding clean pipeline telemetry.
AgentsCustom internal AI assistants that trigger workflows directly from your data.
Unified Warehouse · Semantic SQL · 07:30 AI Briefs
Share the tools you currently run on. We will design a unified semantic reporting layer and automated briefing flow for your leadership team.